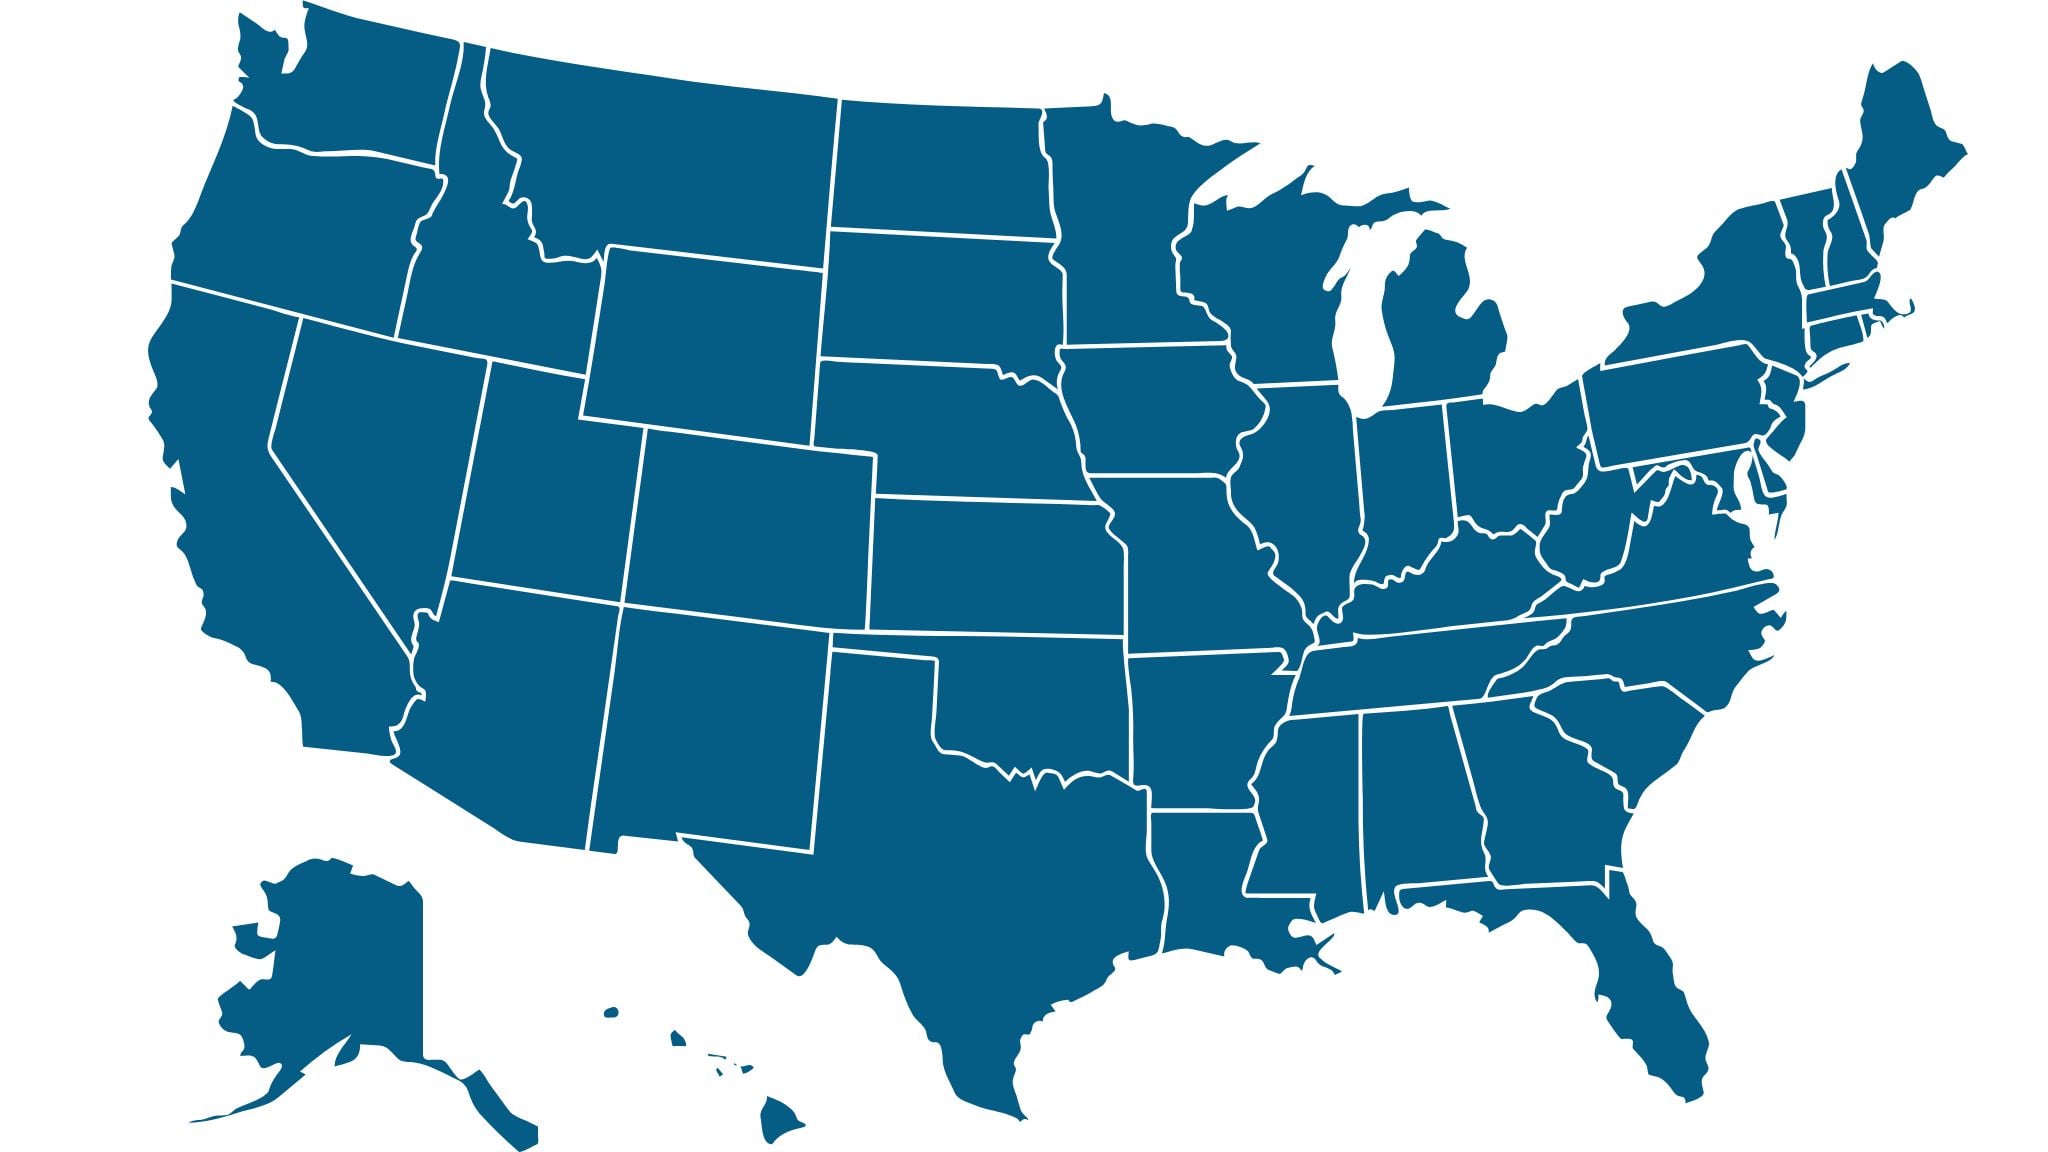
No state in America has perfectly clean tap water. That is not a dramatic claim. It is simply what the data shows. Based on EPA violation data, contaminant testing, and infrastructure assessments, the states with the most documented tap water problems in 2026 are Texas, California, New York, New Jersey, Florida, Pennsylvania, Louisiana, Arizona, Wisconsin, and Massachusetts. The most common problems across these states are PFAS, lead service lines, disinfection byproducts, arsenic, and nitrates.
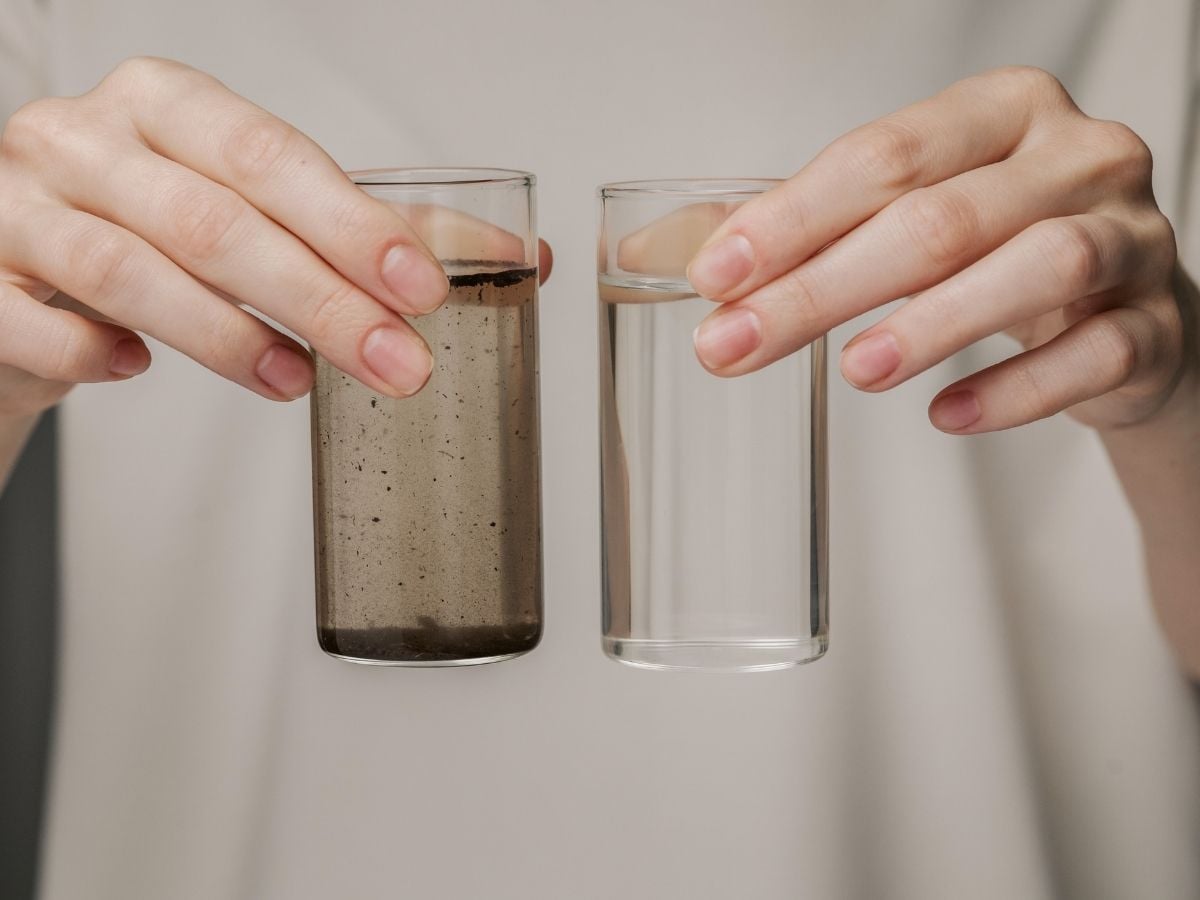
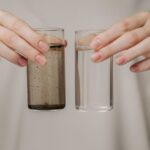
Nearly 45 percent of US tap water contains at least one PFAS compound, and the challenge for most families is that contamination is not visible. You can drink water for years without knowing it contains PFAS, arsenic, or disinfection byproducts at levels that exceed what health researchers consider safe.
This list is worth understanding, not as a source of panic, but as a practical guide to what the most common water quality risks actually are, why they exist, and what homeowners in affected states should do about it.
Texas
More than 700 water systems in Texas, reaching 8.6 million people, had total trihalomethane levels above the EPA’s legal limit of 80 parts per billion. Texas has more medium, large, and very large water systems with unsafe trihalomethane levels than any other state.
Trihalomethanes are disinfection byproducts, meaning they form when chlorine used to treat water reacts with naturally occurring organic matter. They are a byproduct of the treatment process itself, not a source contamination event. Arsenic from groundwater sources is also a persistent concern in parts of the state.
California
California’s problems are concentrated but severe. PFAS contamination near military bases and industrial sites affects communities across the Central Valley and Southern California. The state also has significant nitrate contamination in agricultural regions, where runoff from fertilizer has been infiltrating
groundwater for decades. Many smaller water systems in rural California serve communities that lack the financial resources to upgrade treatment infrastructure to address newer contaminants.
New Jersey
Tap water in New Jersey may contain as many as 131 contaminants. PFOA levels in one system reached 36.1 parts per trillion, more than twice the state limit of 14 ppt, resulting in a violation notice and a $4.9 million settlement for roughly 60,000 affected residents. A private well in Warren County tested for some of the highest PFAS levels ever recorded in New Jersey and among the highest in the nation. New Jersey’s industrial history is long and its groundwater contamination footprint reflects it.
Pennsylvania
A 2025 USGS study found PFAS in 76 percent of 161 Pennsylvania rivers and streams. A separate study found 65 percent of private wells sampled in the state contained PFAS, with 18 percent exceeding EPA maximum contaminant levels. The worst documented case is a mobile home park in Berwick where levels exceeded 2,100 parts per trillion, more than 500 times the federal limit of 4 ppt. Pennsylvania also has thousands of small water systems with aging infrastructure, many serving rural communities with limited capacity to address compliance requirements.
Massachusetts
Massachusetts making this list surprises some people given the state’s generally progressive environmental reputation. Tap water in Massachusetts may contain as many as 132 contaminants. More than 80 percent of taps in Massachusetts schools and child care centers tested positive for lead, exposing children to a neurotoxin with no safe level of exposure. PFAS contamination from military bases and industrial sites is documented across multiple communities. The state has active enforcement mechanisms, but a very old distribution infrastructure in many cities and towns.
Louisiana, Arizona, Wisconsin, Florida, New York
Louisiana’s petrochemical corridor leaves a long contamination footprint in both surface water and groundwater.
Arizona deals with naturally elevated arsenic and minerals from deep aquifer sources, along with contamination tied to military installations.
Wisconsin has documented PFAS contamination affecting both municipal systems and private wells, particularly near foam-using industrial sites.
Florida’s sandy soils and flat topography make groundwater highly vulnerable to surface contamination from septic systems, agriculture, and development.
New York’s challenges are concentrated in older urban systems with lead service lines and suburban communities with PFAS contamination from industrial sites and airports.
What this means if you live in one of these states
The first thing worth understanding is that a state appearing on this list does not mean every water system in that state is failing. It means that across multiple data sources, those states show up consistently as having more documented problems than average. Your specific utility or your private well may be in excellent condition. The only way to know is to test.
The second thing worth understanding is that EPA legal limits and actual health- based guidelines are not the same number. The EPA regulates approximately 90 contaminants, but over 200 can be detected in municipal systems. A water system can be fully compliant with every EPA requirement and still contain contaminants at levels that health researchers consider concerning. Compliance means the utility is following the rules. It does not mean the water is at the level your body would prefer.
Boiling is not the answer for most of these contaminants either. Boiling kills bacteria and parasites but does not remove PFAS, lead, arsenic, disinfection byproducts, or VOCs. Boiling actually concentrates dissolved contaminants because the water volume decreases while the chemicals remain.
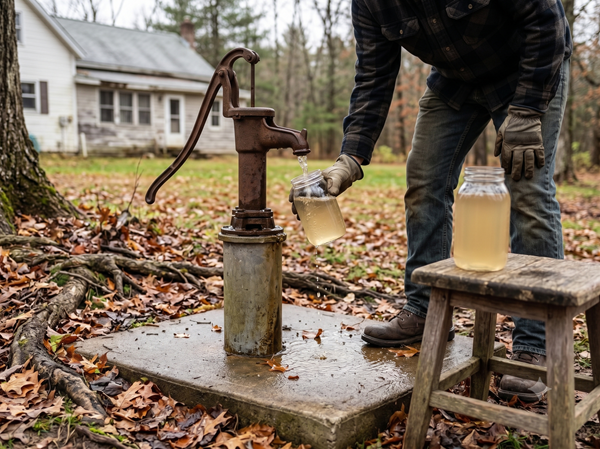
The practical response is straightforward: test your water at the point of use, understand what you find, and make filtration decisions based on actual results rather than assumptions about your state or utility. Homeowners in every state on this list, and frankly in every state off it, are better served by knowing than by guessing.
At ETR Laboratories, we test water for homeowners nationwide. Our reports don’t just return numbers next to thresholds. They break down what each finding means, what the health considerations are, and what types of filtration are appropriate for your specific situation. Contact us for a free consultation or browse our water testing options.
Sources:
- Aquaria — [Worst Tap Water States in 2026: What the Data Shows]
(https://www.aquaria.world/blog-posts/worst-tap-water-states-2026)
- Clearly Filtered — [2026 Top 10 States with the Dirtiest Water]
(https://clearlyfiltered.com/articles/2026-top-10-states-with-the-dirtiest-water)
- Clean Air and Water — [Pennsylvania Water Quality Report 2026]
(https://cleanairandwater.net/pennsylvania-the-keystone-state/)
- TapWater.org — [Best and Worst Tap Water in the US: 2026 State Rankings]
(https://www.tapwater.org/blog/best-worst-tap-water-us-state-rankings)
- EPA Drinking Water Dashboard / Environmental Working Group Tap Water
Database